Part of the series: Logging and Debugging High Throughput Services
For a little more of the background behind this, check out the series landing page. The short of it is we have a payment gateway service that is made up of a bunch of Windows Services, mostly WCF but some WebAPI in the mix. Six or so main services and a whole bunch of ancillary services, talking to 30+ banks and financial entities, and some security appliances. Requests come in through two main entry points but how they flow through the system depends largely on the type of transaction and the customer’s configuration. To keep things interesting there’s also some retry and batch processing.
When I got there what the developers (all three of them) working on a bug or feature would do is run all the services in debug locally, send test transactions at the entry points using some tools we built, and then use external log viewers (BareTail, Notepad++, etc.) to look at the log messages as the services processed their tests and spit out traces.
Each service would launch a more or less blank console window when it was debugged. So imagine a bunch of blank service console windows and a separate viewer app running looking at their files. A test tool. Add in Visual Studio, SSMS (SQL Server Management Studio), a browser, your email, maybe a chat client (AIM or Yahoo Messenger at the time), and maybe a media player (remember Winamp?). These are old systems, hooked up to really early LCDs, running at pretty low resolutions. With all of this going on we were running out of screen space and it was becoming hard to work.
What’s funny is how little has changed! Some of the tools are different, and the monitors have a lot more pixels, but we still have a lot of things open when we’re developing, maybe more than we did then. I routinely have two or three Visual Studios open. It’s a universal rule that if something is hard and not strictly required, it tends to be skipped. People take the path of least resistance, like water. Because it was hard to look at the log files, our developers didn’t really invest in them. If you had a production issue, you had to make guesses or hope someone figured out steps to reproduce the problem. Most of our time was being wasted playing hide and seek with our own product. So the first step in our tracing journey was improving the development experience so the fidelity of the tracing would be high.
One day I got to thinking: We have these services spawning console windows, why not do something more useful with them? A little bit of code and, voila, we had a library incorporated into the services that changed the startup behavior so that if they were launched in “debug mode” a Windows Forms UI would be shown that would plug into the logging pipeline and display the messages in a nice tabbed view as they were written out. We called it “ConsoleUI” and it became very popular. So popular that it is still being used today, as far as I know.
That was all .NET Framework. The services I’ve been doing lately couldn’t use this tool because we didn’t have a UI framework in .NET Core. And boy how I have missed it! Back to log viewers. But late last year things changed and we got .NET Core 3 which supports Windows Forms (and Windows Presentation Foundation). Over the holidays, with a little extra time on my hands, I decided to try and build a new and improved service debugging utility running on the new bits. What I wanted it to do was (on Windows) replace the boring .NET Core console window we get out of the box with a new UI plugged into the logging platform so that it can display messages in realtime as they are written. Basically, something really easy for developers to consume and more worthy of the screen realty.
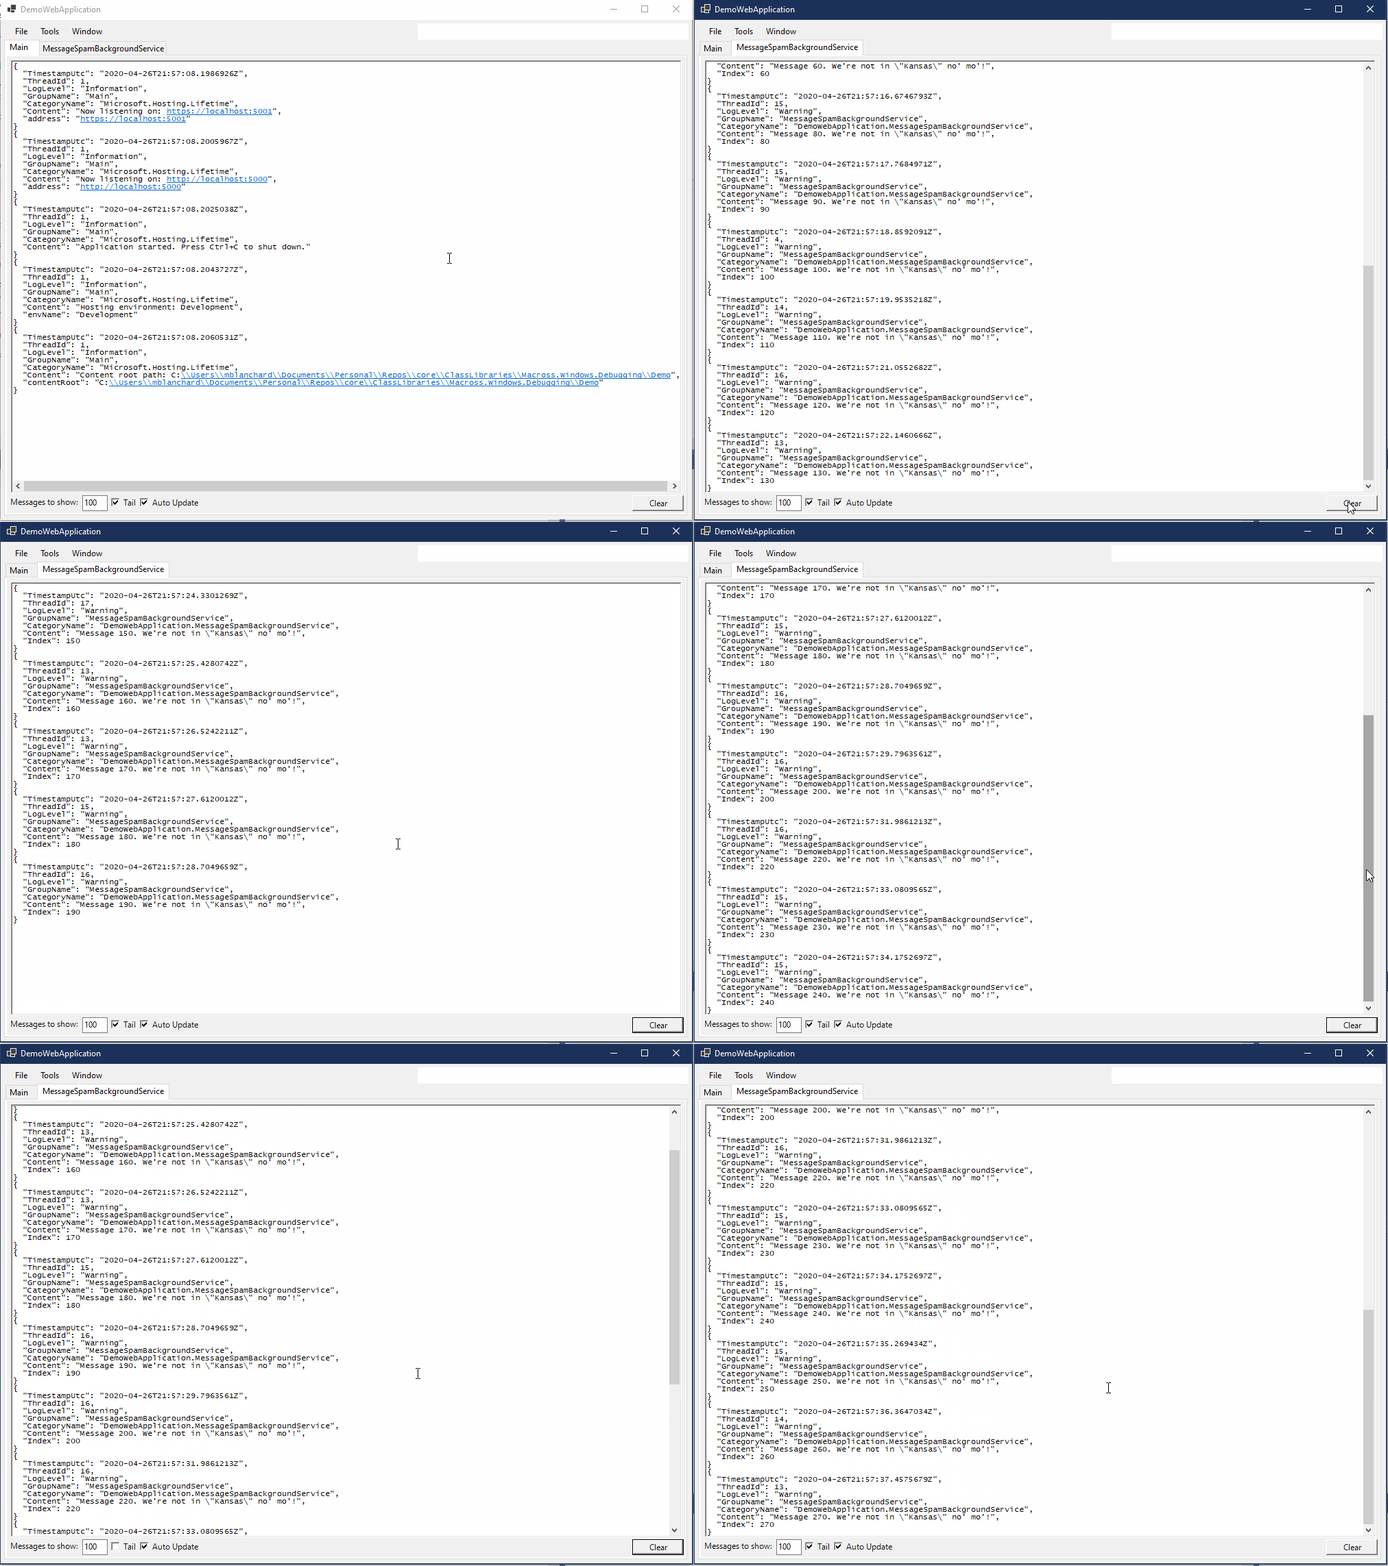
I decided to open source it so others could also benefit and hopefully contribute back useful things. And so Macross.Windows.Debugging was born. It looks like this:

It’s really easy to use, just bootstrap like this:
internal class Program
{
	public static void Main(string[] args) => CreateHostBuilder(args).Build().Run();

	public static IHostBuilder CreateHostBuilder(string[] args)
	{
		return Host
			.CreateDefaultBuilder(args)
			.ConfigureWebHostDefaults(webBuilder => webBuilder.UseStartup<Startup>())
			.ConfigureDebugWindow();
	}
}
The key part is the ConfigureDebugWindow call at the bottom of the CreateHostBuilder method. Easy, right? There’s some advanced configuration if you’re interested.
What is shown in that animation are two tabs: “Main” and “MessageSpamBackgroundService.”
That is demoing a feature for grouping related log messages together. That was another lesson we learned midway through our journey. Logically grouping messages together made it much easier to troubleshoot. A certain bank would have all its messages in a named file. A certain process would have all its messages in a named file. When we eventually moved to a log aggregation system (more on that later), the group became a source field.
Groups are built on top of log scopes. Create one when your process starts, and then dispose it when you are done:
using IDisposable Group = _Logger.BeginGroup("Business Logic Area");

_Logger.LogInformation("Starting logical process.");

await ExecuteProcess().ConfigureAwait(false);

_Logger.LogInformation("Logical process complete.");
You can also set up groups in your IConfiguration but I personally prefer the code solution.
The point of all of this is to put the information right in front of the developer so it’s part of their dev/test loop. We want the logging to be the go-to view of the system. That way they will make them great naturally as part of their day-to-day workflow. Basically, we are dogfooding what we’re going to give to support.